Bridging the Gap: Why Modern Social Teams Must Master Data Storytelling to Drive Business Impact

Main Facts: The Social Data Paradox
In the contemporary digital landscape, brand engagement is surging, mentions are climbing, and sentiment trackers are routinely flashing green. Social media managers sit at the epicenter of a digital goldmine, tracking viral product hacks, real-time customer feedback, and unprompted market reactions. Yet, a glaring disconnect persists across corporate boardrooms.
According to the 2026 Social Intelligence Report, a staggering 86% of organizations admit to missing critical business opportunities over the past two years due to social insights being delayed, siloed, or fundamentally underutilized. Furthermore, only 36% of enterprises successfully leverage these rich social insights to inform decision-making outside of traditional marketing silos.
The core issue is not a lack of data; it is an inability to translate raw metrics into a compelling business narrative. When engagement spikes and sentiment scores stay trapped within static marketing dashboards, momentum dies. To bridge this gap, modern organizations are turning to data storytelling—the strategic fusion of data science, narrative arcs, and intentional visualization designed to turn passive spreadsheets into active business decisions.
Chronology: The Evolution of Social Listening to Strategic Intelligence
To understand how enterprises arrived at this data governance crisis, one must look at how social media analytics have evolved over the past decade:

- Phase 1: Vanity Metrics (Early 2010s): Social teams were largely measured by follower counts, likes, and superficial reach. Data reporting was descriptive, answering only what happened on a specific channel.
- Phase 2: The Listening Boom (Late 2010s): Advanced social listening tools emerged, allowing brands to monitor sentiment, track share of voice, and aggregate unprompted consumer feedback. However, these insights remained largely quarantined within marketing and PR departments.
- Phase 3: The Silo Crisis (Early 2020s): As customer touchpoints multiplied, organizations accumulated massive data lakes. CRMs, support tickets, and social listening platforms generated vast streams of information. Unfortunately, poor governance and a lack of cross-functional translation led to massive missed opportunities.
- Phase 4: The Era of Data Storytelling (Present & 2026): Leading organizations are recognizing that social data acts as the world’s largest, unfiltered focus group. The focus has shifted from merely collecting data to constructing compelling, cross-functional narratives that influence product roadmaps, executive strategy, and bottom-line revenue.
Supporting Data: The Quantitative and Qualitative Divide
The necessity of data storytelling is underscored by distinct behavioral gaps in how different departments consume information. Executives naturally gravitate toward quantitative data because it provides an immediate, linear map to the bottom line—revenue growth, cost acquisition, and customer retention.
Conversely, social teams deal extensively in qualitative data: unprompted comments, customer screenshots, viral product hacks, and passionate feedback threads. While numbers establish the baseline, qualitative insights supply the color and emotional resonance needed to validate a trend.
| Data Type | Primary Source | Executive Appeal | Strategic Value |
|---|---|---|---|
| Quantitative | CRMs, Sales Pipelines, Traffic Analytics | High (Direct link to ROI) | Proves scale, volume, and financial trajectory. |
| Qualitative | Social Comments, Influencer Mentions, Forums | Medium (Requires narrative support) | Explains why metrics shift and uncovers emerging market trends. |
When data storytellers successfully pair quantitative metrics (e.g., a 40% surge in website traffic) with qualitative context (e.g., a viral influencer raving about a specific product feature), they build an airtight narrative that commands executive attention.
Official Insights & Frameworks: How to Build a Data Story
Industry leaders and reports from platforms like Sprout Social emphasize that constructing a resilient data story requires a disciplined, step-by-step framework. Organizations can transform raw dashboards into actionable intelligence by adopting a structured methodology:
1. Identify the Core Objective and Interesting Points
Before opening a slide deck, define the primary goal—whether that is justifying a budget increase, pivoting a campaign strategy, or alerting product development to a market shift. Isolate the data points that directly contradict or validate initial assumptions.
2. Lead with the Second-Most Interesting Insight
Avoid laying all your cards on the table immediately, but do not bury the lead. Command attention instantly by connecting known business realities to unseen social correlations. For instance: "As you know, sales are up this quarter. What you may not have seen is how precisely this trend correlates with our surge in social traffic."
3. Deploy Visual Aids with Intent
Visualizations should clarify, not clutter. Use layering techniques—such as overlaying a social referral traffic graph directly onto a quarterly sales chart—to visually demonstrate cause and effect.
4. Anticipate and Preempt Challenges
Stakeholders will inevitably probe the validity of the data. When presenting a correlation, address the age-old question ("How do we know sales are up because social traffic is up, and not the other way around?") directly within your presentation deck before the audience has a chance to ask.
5. Save the Grand Finale for Last
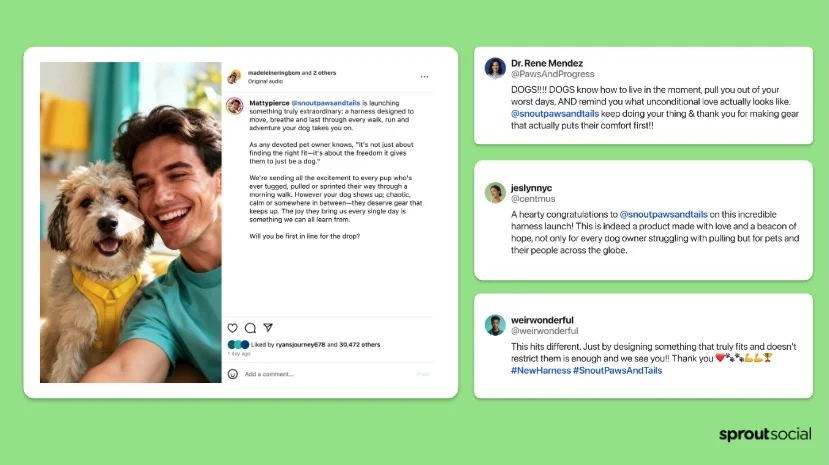
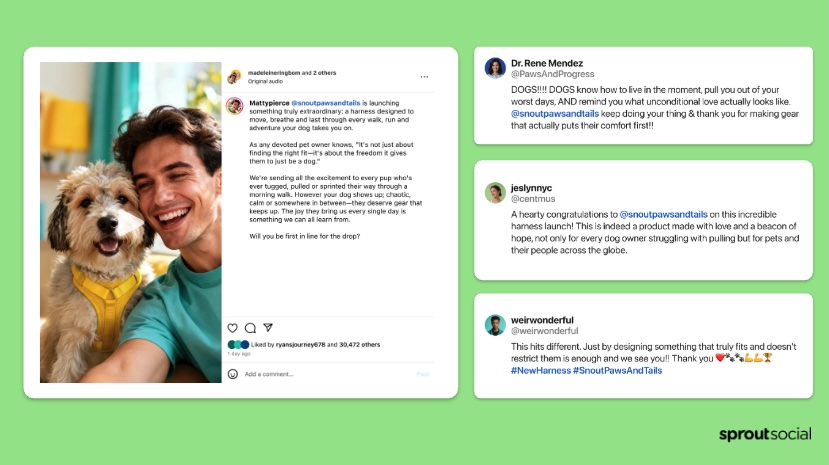
Conclude the data narrative with your most compelling piece of evidence. Provide both quantitative proof and qualitative color. For example, trace 33% of quarterly conversions directly back to a single influencer’s post with 700,000 views, complete with screenshots of enthusiastic consumer replies.
6. Close with the "So What?"
Marketing data storytelling must always answer the ultimate question: So what? Conclude by explicitly stating how these insights shape future business operations, such as targeting similar micro-influencers or adjusting supply chain forecasts based on social demand.
Implications: Crafting a Story That Travels Across Departments
The true benchmark of an effective data story is its longevity and mobility outside the meeting room. A mediocre report captivates an audience for the duration of a presentation and is promptly forgotten. A great data story travels. It gets quoted by executives in high-level strategy sessions and referenced by product engineering teams as the definitive justification for a new feature roadmap.
Real-World Inspiration for Data Storytellers
Organizations looking to elevate their reporting can draw inspiration from innovative pioneers in visual data journalism:
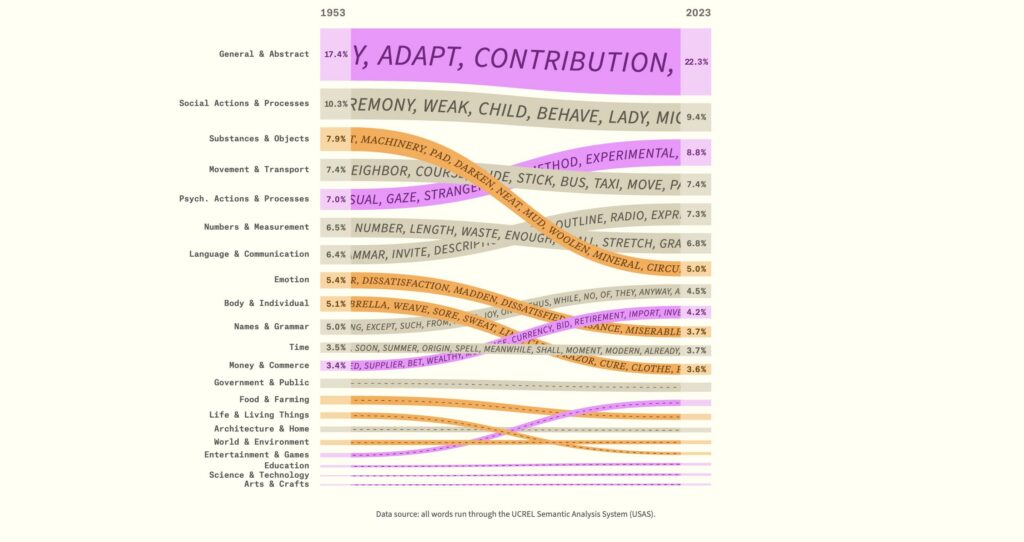
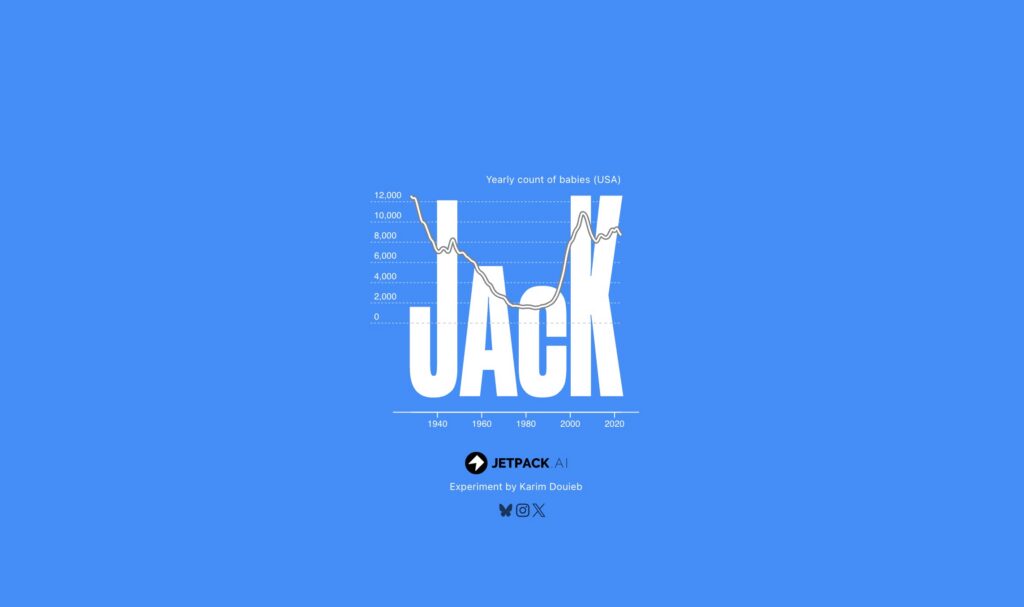
- Jetpack AI: By gamifying data visualization (such as their interactive baby names popularity tracker), they encourage active user participation and intuitive learning.
- The Pudding: Renowned for deep-dive visual essays, they use interactive elements and historical context to make complex lexical and social trends instantly digestible.
- Sprout Social: Their regular industry research reports integrate clean graphic design with actionable takeaways, proving that visuals do not need to be complex bar charts to drive impact—sometimes a highlighted quote or standout statistic is enough.
Moving Forward
By dismantling departmental silos and transforming unfiltered social listening data into structured, empathetic narratives, modern social teams can elevate their influence across the enterprise. Mastery of data storytelling turns social media metrics from isolated vanity numbers into the foundational architecture of future business success.
Related posts: