Navigating the Pump: National Gas Prices Creep Upward Amid Global Geopolitical Tensions

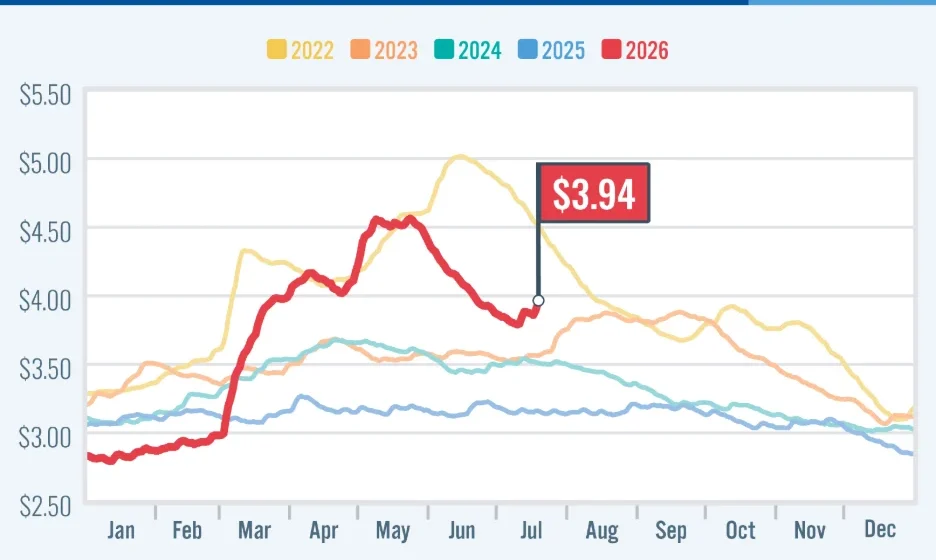
The American motorist is facing a familiar, albeit unwelcome, trend as summer progresses: the steady, incremental climb of gasoline prices. According to the latest report from the American Automobile Association (AAA), the national average for a gallon of regular unleaded gasoline has ticked upward by 10 cents over the past week, settling at $3.94. While this remains below the psychological threshold of $4.00 per gallon—a mark the country has not seen since June 17—the current trajectory suggests that relief at the pump may be short-lived.
As energy markets react to instability in the Middle East and tightening domestic inventories, consumers are left to wonder if the relative stability experienced in the early summer months is beginning to evaporate.
The Core Drivers: Geopolitics and Inventory Constraints
The recent surge in fuel costs is not occurring in a vacuum. The primary catalyst for the current upward pressure on crude oil prices—which are now hovering near the $80-per-barrel mark—is the escalating instability along the Strait of Hormuz. As one of the world’s most critical maritime chokepoints for oil transit, any disruption or threat to the flow of crude through this region creates immediate volatility in global energy markets.
When West Texas Intermediate (WTI) rose by 26 cents at the close of Wednesday’s formal trading session to settle at $79.60, it reflected a market deeply sensitive to the potential for supply chain bottlenecks. This sentiment is further exacerbated by the latest data from the Energy Information Administration (EIA), which paints a picture of a tightening domestic market.
According to the EIA, U.S. crude oil inventories fell by 1.7 million barrels last week, leaving stockpiles at 409.7 million barrels. To put this into perspective, current inventories are roughly 6% below the five-year average for this time of year. When supply falls below historical norms, the margin for error in the refining process shrinks, and price volatility becomes the new standard.
A Chronology of the 2024 Pricing Cycle
To understand the current state of the fuel market, one must examine the volatility of the past six months. Throughout April and May, American drivers navigated a consistent price landscape, with the national average remaining firmly entrenched in the $4.00 range. This period was marked by high seasonal demand and the transition to summer-blend gasoline, which is more expensive to refine.
- April – June: The national average remained consistently at or above $4.00, reaching a localized peak on June 17 at $4.02.
- Late June – Early July: Prices saw a brief period of cooling, dipping slightly below the $4.00 mark as refinery utilization improved and some of the early-summer demand surge leveled off.
- The Current Week: The 10-cent jump recorded by AAA signals a reversal of that cooling trend. While most states still enjoy an average price under $4.00, the steady, week-over-week climb has analysts concerned that the downward pressure on prices has reached its limit.
Supporting Data: Supply and Demand Dynamics
The relationship between fuel production and consumer behavior is a delicate balancing act. The EIA’s latest report shows that while gasoline demand remained flat at 8.84 million barrels per day, the supply side of the equation is tightening.
Total domestic gasoline supply saw a contraction, falling from 212.1 million barrels to 210.5 million barrels in a single week. Simultaneously, gasoline production slowed, averaging 9.6 million barrels per day. When production dips while demand remains stagnant, the result is an inevitable drawdown in reserves. For the average consumer, this means that even if demand does not increase, the mere fact that supply is failing to keep pace with historical averages is enough to drive prices higher.
Geographic Disparity: The Tale of Two Markets
Gasoline prices are rarely uniform across the United States, as regional factors—including state taxes, local refinery proximity, and environmental regulations—create a wide chasm between the most and least expensive states.
The Most Expensive Markets
The top 10 most expensive gasoline markets are currently dominated by states with stringent environmental standards and higher-than-average fuel taxes.

- Hawaii: $5.43
- California: $5.40
- Washington: $4.98
- Alaska: $4.67
- Nevada: $4.55
- Oregon: $4.51
- Illinois: $4.12
- Arizona: $4.12
- New York: $4.10
- Michigan: $4.07
The Most Affordable Markets
Conversely, the "fuel belt" of the U.S. continues to provide significant savings, largely due to proximity to Gulf Coast refining hubs and lower state-level excise taxes.
- Indiana: $3.31
- Mississippi: $3.49
- Louisiana: $3.53
- Texas: $3.54
- Oklahoma: $3.55
- Tennessee: $3.55
- Arkansas: $3.55
- Kentucky: $3.56
- Alabama: $3.58
- Missouri: $3.60
The Electric Frontier: Charging Costs Remain Stagnant
While the conversation often centers on gasoline, the expanding infrastructure for electric vehicles (EVs) provides a secondary lens through which to view energy costs. The national average per kilowatt-hour (kWh) at public charging stations remained unchanged this week at 42 cents.
Much like gasoline, the cost of "refueling" an EV varies drastically by state, influenced by local utility rates and the availability of high-speed charging infrastructure.
Top 10 Most Expensive States for Public Charging (per kWh):
West Virginia (52 cents), Hawaii (51 cents), Alaska (49 cents), New Hampshire (47 cents), California (46 cents), Louisiana (46 cents), Illinois (45 cents), New Jersey (45 cents), Arkansas (44 cents), and Arizona (44 cents).
Top 10 Least Expensive States for Public Charging (per kWh):
Kansas (30 cents), Missouri (32 cents), Iowa (33 cents), Maryland (34 cents), Utah (34 cents), Nebraska (35 cents), South Dakota (35 cents), Vermont (35 cents), New Mexico (37 cents), and Minnesota (37 cents).
Implications for the American Consumer
The economic implications of rising energy costs are far-reaching. When gasoline prices climb, the cost of transporting goods—from groceries to consumer electronics—also rises, often leading to inflationary pressures in other sectors of the economy.
For the average household, a 10-cent increase may seem negligible on a single tank, but for commuters and families with multiple vehicles, the cumulative effect over a month can result in a significant shift in discretionary spending. Furthermore, as crude oil prices approach $80 per barrel, the energy sector’s focus will remain fixated on the Strait of Hormuz. Any further escalation in geopolitical tensions could trigger a sharper spike, potentially pushing the national average back into the $4.00-plus territory that defined the spring.
Looking Ahead
The coming weeks will be critical. If domestic production can rebound to meet seasonal demand, the current price increase may prove to be a localized fluctuation. However, if crude inventories continue to dwindle and global instability persists, the "climb" described by industry experts may turn into a more aggressive upward trend.
Motorists are encouraged to monitor local fuel apps and plan routes efficiently to mitigate the impact of these rising costs. As the energy market remains at the mercy of global politics and domestic production capacities, the only certainty is that the stability many hoped for this summer remains elusive. Consumers should prepare for a period of ongoing volatility, as the cost of mobility remains tethered to a global energy market that is, at present, anything but predictable.