

In an era where social media ad spending is projected to surpass $121 billion in the U.S. alone by 2026, the margin for error in digital marketing has evaporated. For enterprise-level organizations, agencies, and high-growth brands, the sheer volume of data generated across TikTok, X, LinkedIn, Facebook, and Instagram can be paralyzing.

The solution—and the defining tool for the modern marketing stack—is the social media dashboard. A well-constructed dashboard is more than a collection of charts; it is a unified command center that transforms raw data into actionable intelligence. By aggregating metrics into a single interface, teams can pivot from reactive "firefighting" to proactive, data-driven strategy.

The Evolution of Social Media Measurement
Historically, social media teams were forced to manually aggregate data from native platform analytics. This "spreadsheet-heavy" approach was not only time-consuming but prone to human error, often leaving teams hours behind the pace of digital trends.
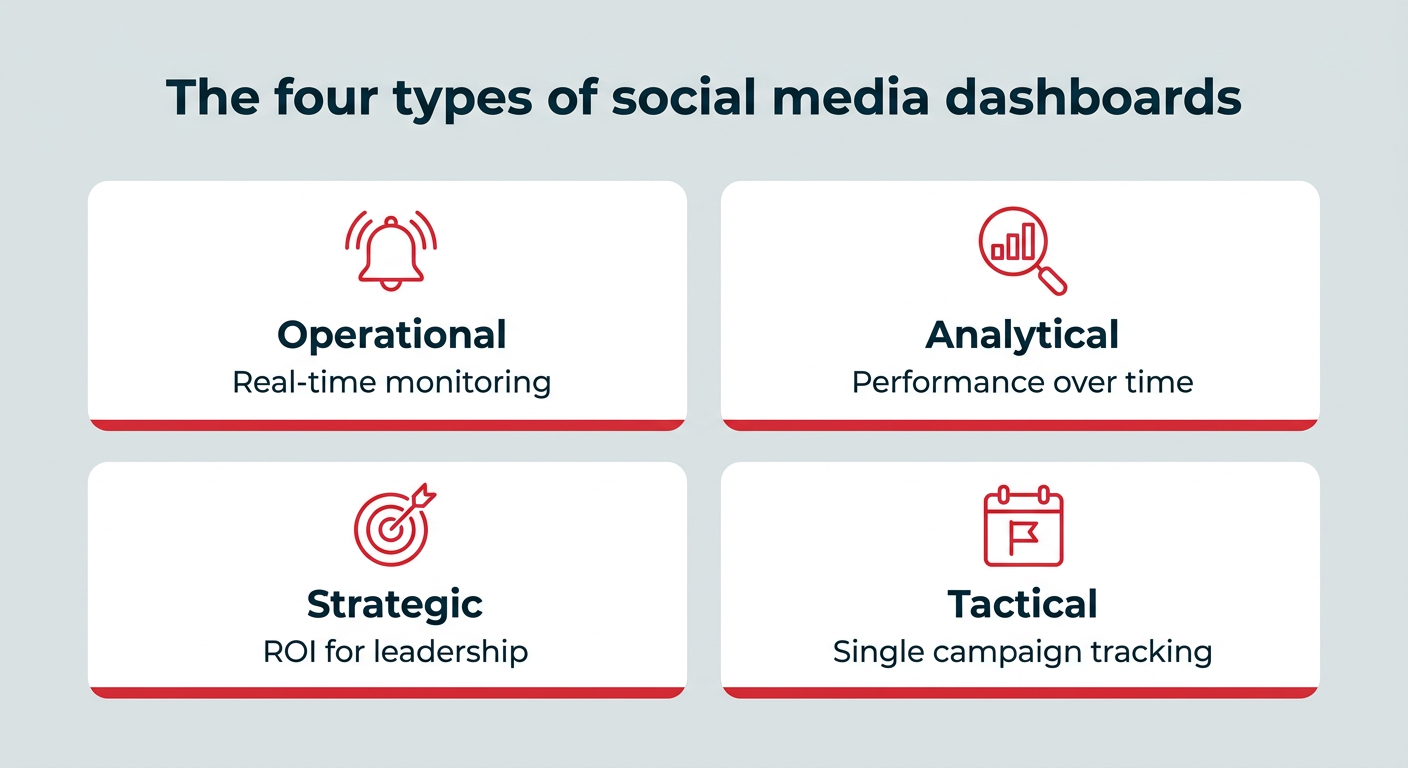
Today’s dashboards have evolved into sophisticated, real-time ecosystems. Whether utilizing robust, integrated platforms like Hootsuite Social OS or modular, DIY solutions like Google Looker Studio, the core value remains the same: context. Modern dashboards provide the ability to filter by platform, campaign, date range, or specific KPI, allowing stakeholders to see how social efforts contribute to broader business goals like lead generation, customer sentiment, and revenue.
A Chronology of Dashboard Utility
The implementation of a dashboard typically follows a specific maturity cycle within an organization:

- The Setup Phase (Weeks 1–2): Identifying key goals—whether awareness, engagement, or conversion—and selecting the appropriate dashboard architecture.
- The Integration Phase (Weeks 3–4): Connecting social channels and CRM systems to ensure data continuity.
- The Calibration Phase (Month 2): Establishing baselines and benchmarks against competitors.
- The Optimization Phase (Ongoing): Leveraging AI-powered insights to refine content calendars and ad spend in real-time.
Categorizing the Dashboard: Four Pillars of Reporting
Not all dashboards are created equal. According to industry standards, effective reporting falls into four distinct categories, each serving a specific organizational function:
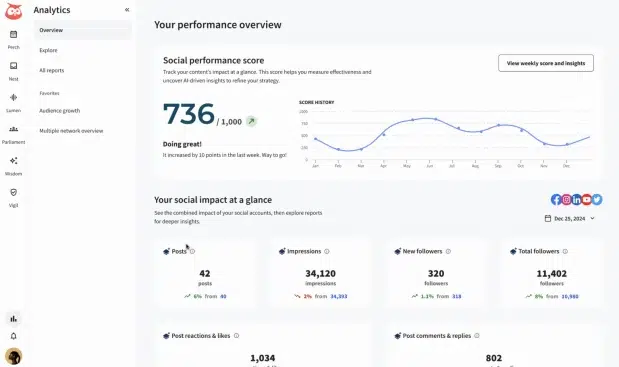
- Operational Dashboards: Designed for community and care teams to monitor real-time activity, response times, and sentiment spikes.
- Analytical Dashboards: The playground for social media managers, focusing on deep dives into content resonance, audience demographics, and performance over extended timelines.
- Strategic Dashboards: Built for CMOs and VPs, these prioritize high-level ROI, business impact, and year-over-year growth metrics.
- Tactical Dashboards: Used by campaign specialists to track the pulse of specific product launches or seasonal promotions from inception to conclusion.
Supporting Data: Why Dashboards Are Business-Critical
The pressure on marketing budgets is mounting. With 59% of CMOs reporting insufficient funding to execute their strategies and marketing spend hovering at approximately 7.8% of overall company revenue, the ability to prove ROI is no longer optional—it is a requirement for survival.
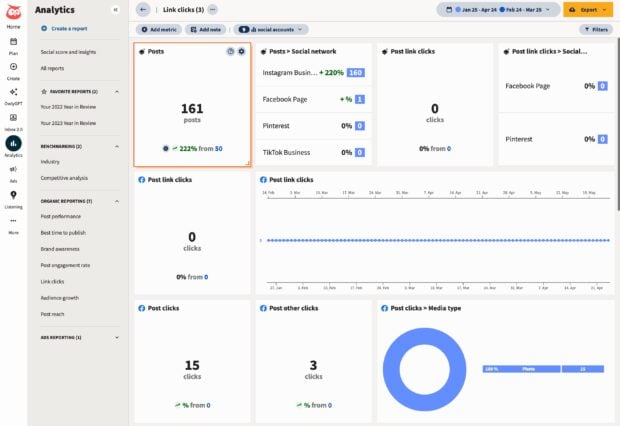
A dashboard provides the narrative evidence required to defend budget requests. By visualizing the correlation between social engagement and downstream actions—such as website traffic, sign-ups, and conversions—teams can illustrate the tangible value of their work. Furthermore, with global social ad spending projected to reach $530 billion by 2030, the cost of "not knowing what is working" is a financial risk that most enterprises can no longer afford to ignore.
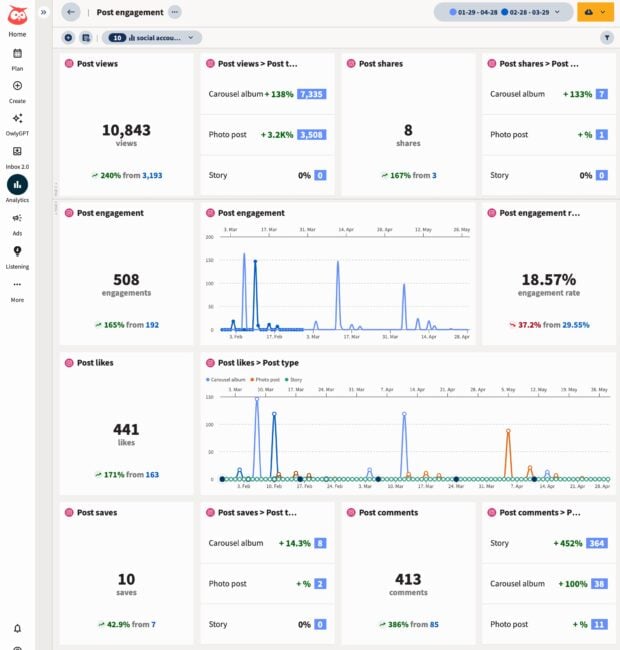
Strategic Implications: Matching Metrics to Objectives
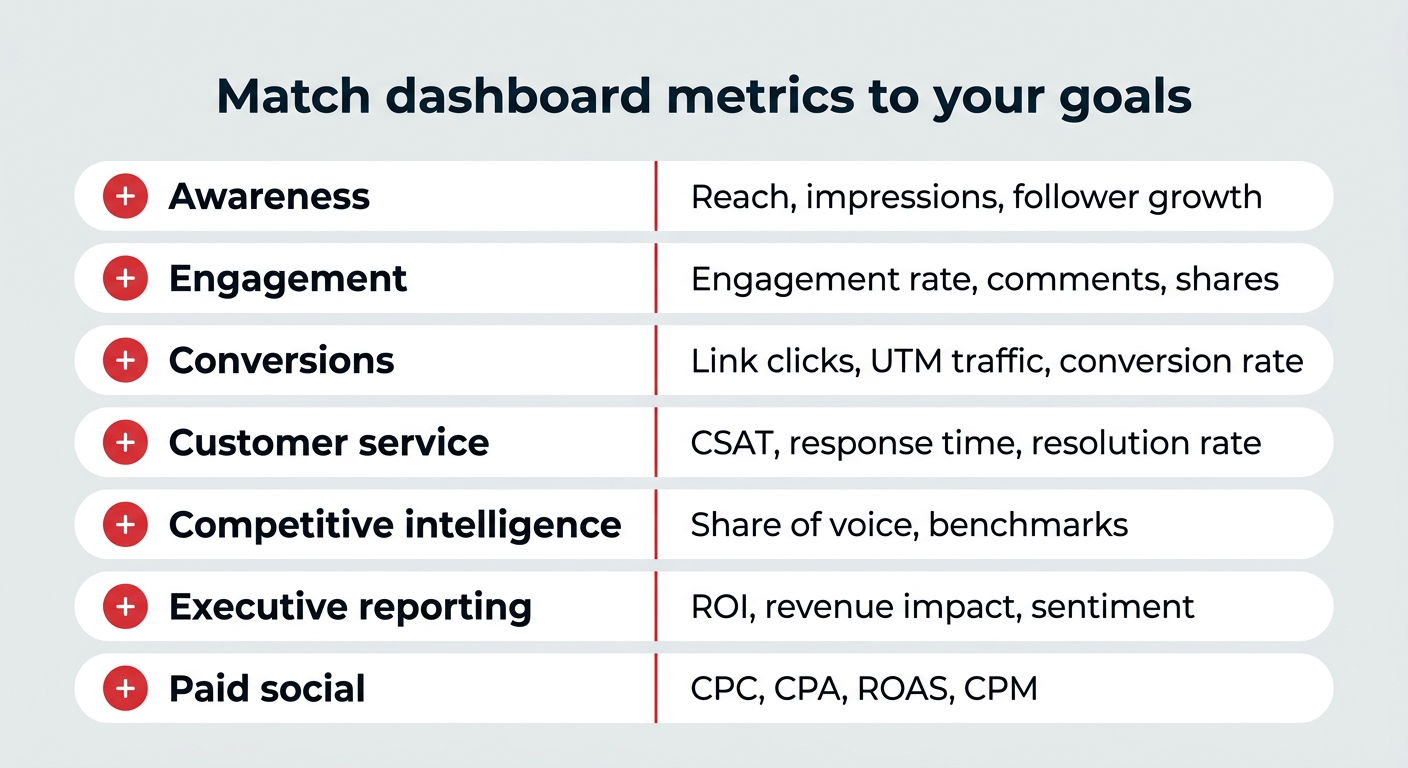
To avoid "dashboard clutter," metrics must be strictly mapped to business objectives. The following table serves as a blueprint for aligning goals with data:
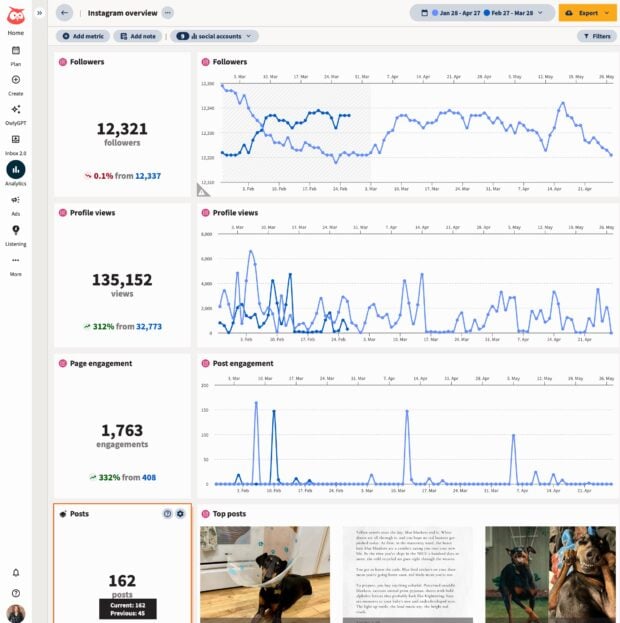
| Goal | Key Metrics | Primary Dashboard Type |
|---|---|---|
| Awareness | Reach, Impressions, Follower Growth | Brand Awareness |
| Engagement | Engagement Rate, Shares, Saves | Content/Engagement |
| Conversion | Link Clicks, UTM Traffic, Conversion Rate | Conversion/Traffic |
| Service | CSAT, Response Time, Resolution Rate | Social Customer Service |
| Competitive | Share of Voice, Benchmarks | Competitive Analysis |
Official Perspectives: The Value of Connected Systems
Industry leaders emphasize that the value of a dashboard lies in its connectivity. Trish Riswick, Social Media Lead at Hootsuite, notes that the use of custom tagging is crucial for enterprise success. "We tag our posts according to which of our three pillars they belong to, then pull analytics reports for each of those tags," Riswick explains. This granular level of reporting allows for a nuanced understanding of which content themes drive results, moving beyond vanity metrics like raw "likes" to meaningful business outcomes.
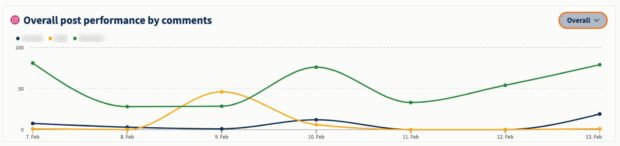
Furthermore, the integration of AI—such as Hootsuite’s "Lumen" app—has changed the landscape of social listening. By processing millions of conversations in real-time, AI-driven dashboards can surface trends and anomalies that human analysts might miss, allowing for faster, more accurate strategic pivots.

Implementation: The Two Paths to Dashboarding
Organizations typically choose between two paths when building their reporting architecture:
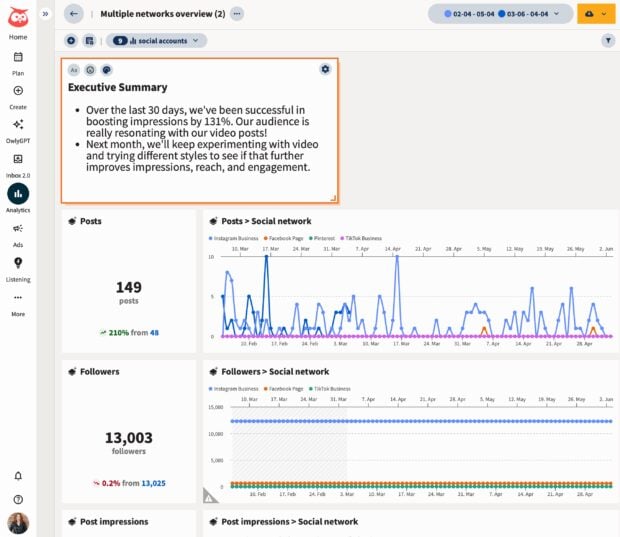
1. The Integrated "Social OS" Approach
Platforms like Hootsuite Social OS offer pre-built templates that require minimal setup. The primary advantage here is the "connected system" model—where publishing, listening, and analytics occur in one environment. This ensures that the data you report on is inextricably linked to the activity your team logs, minimizing data silos.
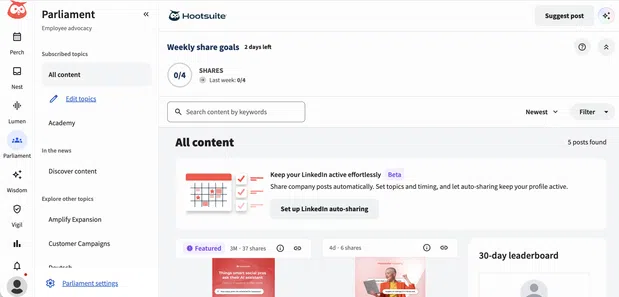
2. The Custom "DIY" Approach
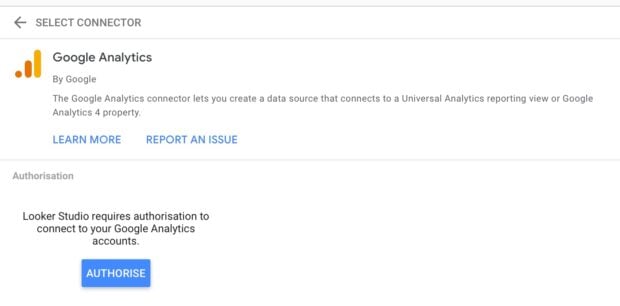
For budget-conscious teams or those with highly specific data requirements, Google Looker Studio remains a popular, free option. However, this path requires a significant investment in time. The process involves:
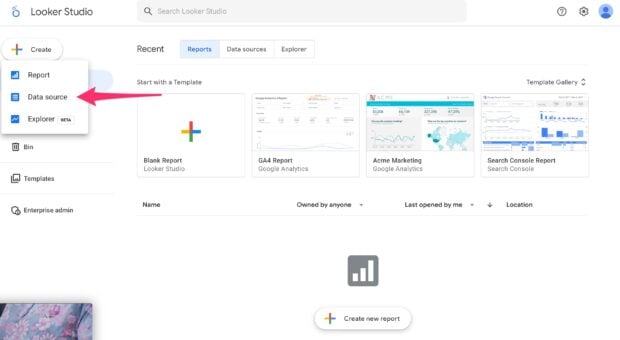
- Data Source Creation: Connecting Google Analytics 4 and other APIs.
- Manual Configuration: Building individual widgets and charts.
- Ongoing Maintenance: Ensuring the dashboard remains functional as platform APIs evolve.
Best Practices for Dashboard Success
Regardless of the tool chosen, five golden rules apply to ensure the dashboard remains a strategic asset rather than a digital paperweight:
- Define the Audience: Do not show an executive a granular list of post-level clicks; show them the trend line of revenue impact.
- Focus on Trends: A single data point is noise. A trend line is insight.
- Ensure Actionability: If a metric doesn’t lead to a decision, remove it.
- Standardize Reporting: Consistency across periods allows for accurate benchmarking.
- Contextualize with History: Performance only has meaning when compared to previous benchmarks.
Conclusion: The Path Forward
The modern social media landscape is complex, fast-moving, and increasingly expensive. Organizations that rely on intuition or fragmented data will inevitably fall behind. By adopting a disciplined approach to dashboarding—matching the right tool to the right goal and ensuring all stakeholders receive the data they need—brands can transform their social media presence from an experimental channel into a predictable, high-performing engine of business growth.
Whether you are a startup scaling your first campaign or an enterprise managing hundreds of global accounts, the command center is your greatest asset. It is time to stop looking at disparate tabs and start looking at the bigger picture.
Related posts: